
The first thing to note in the above figure is that global oil production (crude, shown with the orange line and on the left axis) was climbing quite steadily until 2004. Then, for some reason, amidst a period relatively high economic activity (ah, the good times, remember them?), oil production has plateaued. Up until 2004, prices were pretty stable (blue, right axis). Then, prices started to spike. What is interesting is how these two events coincided. This is the tightening of the supply-demand spread.
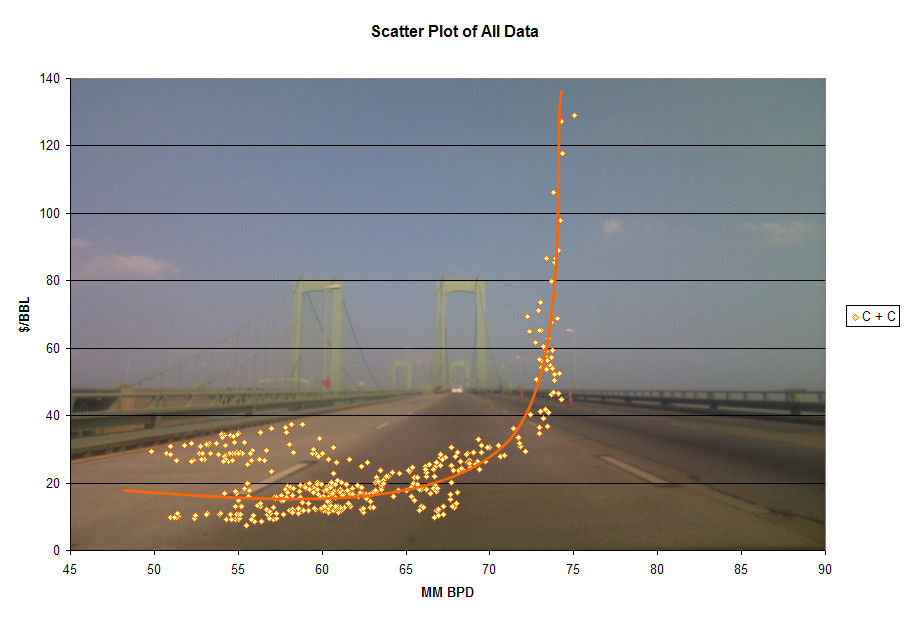
Why did the price spike exponentially? And why did it drop so dramatically? At the Oil Drum, one of the contributors prepared a chart of Oil Price versus total global oil product. The chart below shows it all: Global Crude Oil Production Versus Oil Price / Barrel
 Global Crude Oil Production Versus Oil Price / Barrel
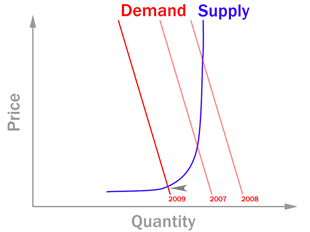
Basically, the world hit the oil production wall - somewhere around 74 million barrels of crude a day. As we approached our maximum potential global oil production, the price spiked - it went vertical! This also explains why the price collapsed so quickly. When demand dropped off because of global slowdown (caused by high oil prices, see my previous post on this topic), we slid left a bit on this chart, and the prices plummeted. This explains it: as we reach total global output, the price goes exponential, as demand slacks a bit from peak global output, the price crashes. This is illustrated a bit more graphically below (from the same article):
 Future Spikes / Crashing into the Wall
So, will we spike again? YES- and sooner. Because of declining total production capacity (exacerbated by the current lack of investment in oil development give poor economic climate), our maximum global oil production (or peak) is dropping. As such, the WALL of maximum production is moving down (or left on the graph). So, we will run into it sooner next time demand starts to grow. And this will continue to move down, causing more price spiking, and we move past 50% total global production of oil.
Insulation anyone?
FOLLOWUP NOTE: Oh, by the way, Non-OPEC (e.g. the rest of the world) has been confirmed as passing peak production in 2004.


No comments:
Post a Comment